Graphs
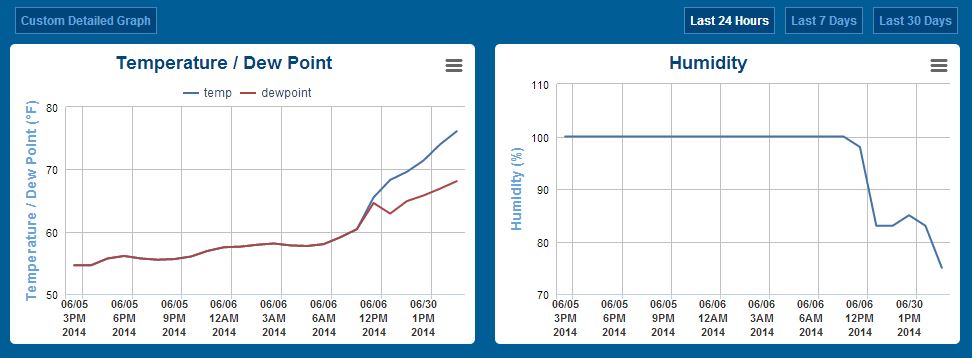
 The “Graphs” tab of your weather page is where graphs of each sensor enabled for your weather station can be viewed.
By following a graph line with your cursor, it will give you the value at that instance.
Click on the chart context menu (three gray bars in upper right corner of graph) to print or download a graph.
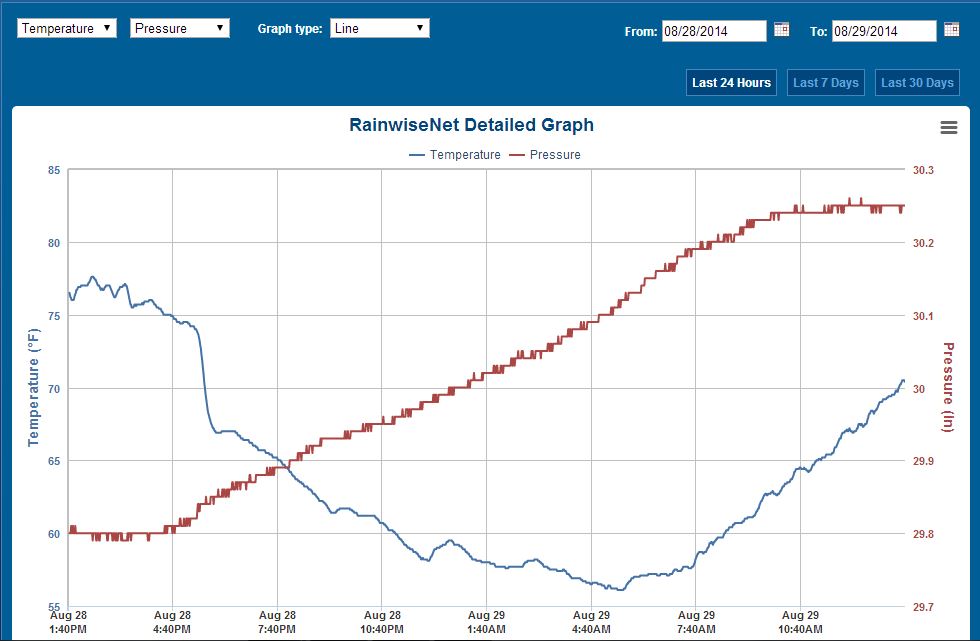
You can also select “Custom Detailed Graph” in the upper left hand corner and choose which parameters you want to view. A screen should appear similar to the image seen below. You may change the graph type to a bar graph under “graph type”. By clicking on the calendar icon you can select what dates you want to view your data from, or you can enter the dates manually. Keep in mind each graph will have different units and scales for each parameter selected. 
Next Page: Alarms
Previous Page: Current Weather